Bloggers and publishers
Which posts died, and which are worth updating
Your traffic does not drift, it steps. A core update lands, and a week later the graph is sitting at a different level with no note saying which of your posts paid for it. Search Console will tell you the site is down, and its compare view will put a thousand pages side by side. What it will not do is sort them for you: no bucket for the posts that stopped appearing altogether, and no line between a post that collapsed and one that slipped a place or two and is still worth an afternoon.
20 impressions needed in both periods before a rank change is printed
~16 months of daily data Google still holds, copied in on the first sync
24 months kept on a paid site's rolling archive, so last September is still there
Last September, to compare this September against.
Search Console holds roughly sixteen months and then deletes a day at a time, which is enough for a year-on-year comparison right up until the month you need it. On connection we copy in every day Google still holds, about sixteen months of it, and then keep appending, once a day on either plan. A paid site keeps a rolling 24 months, about eight more than Google, and a free site a rolling 14 days, each trimmed back to that at the end of every sync, so holding a year and more of daily page and search detail, including the month Google has already dropped, is the thing paying for a site buys.
Google's own BigQuery export cannot do that half at any price: it records forward from the day you switch it on and never fills in the past, which is why it is worth switching on today and is not a substitute for having copied the past already.
24 months of historyAn update moves the site; a page list says which posts it moved.
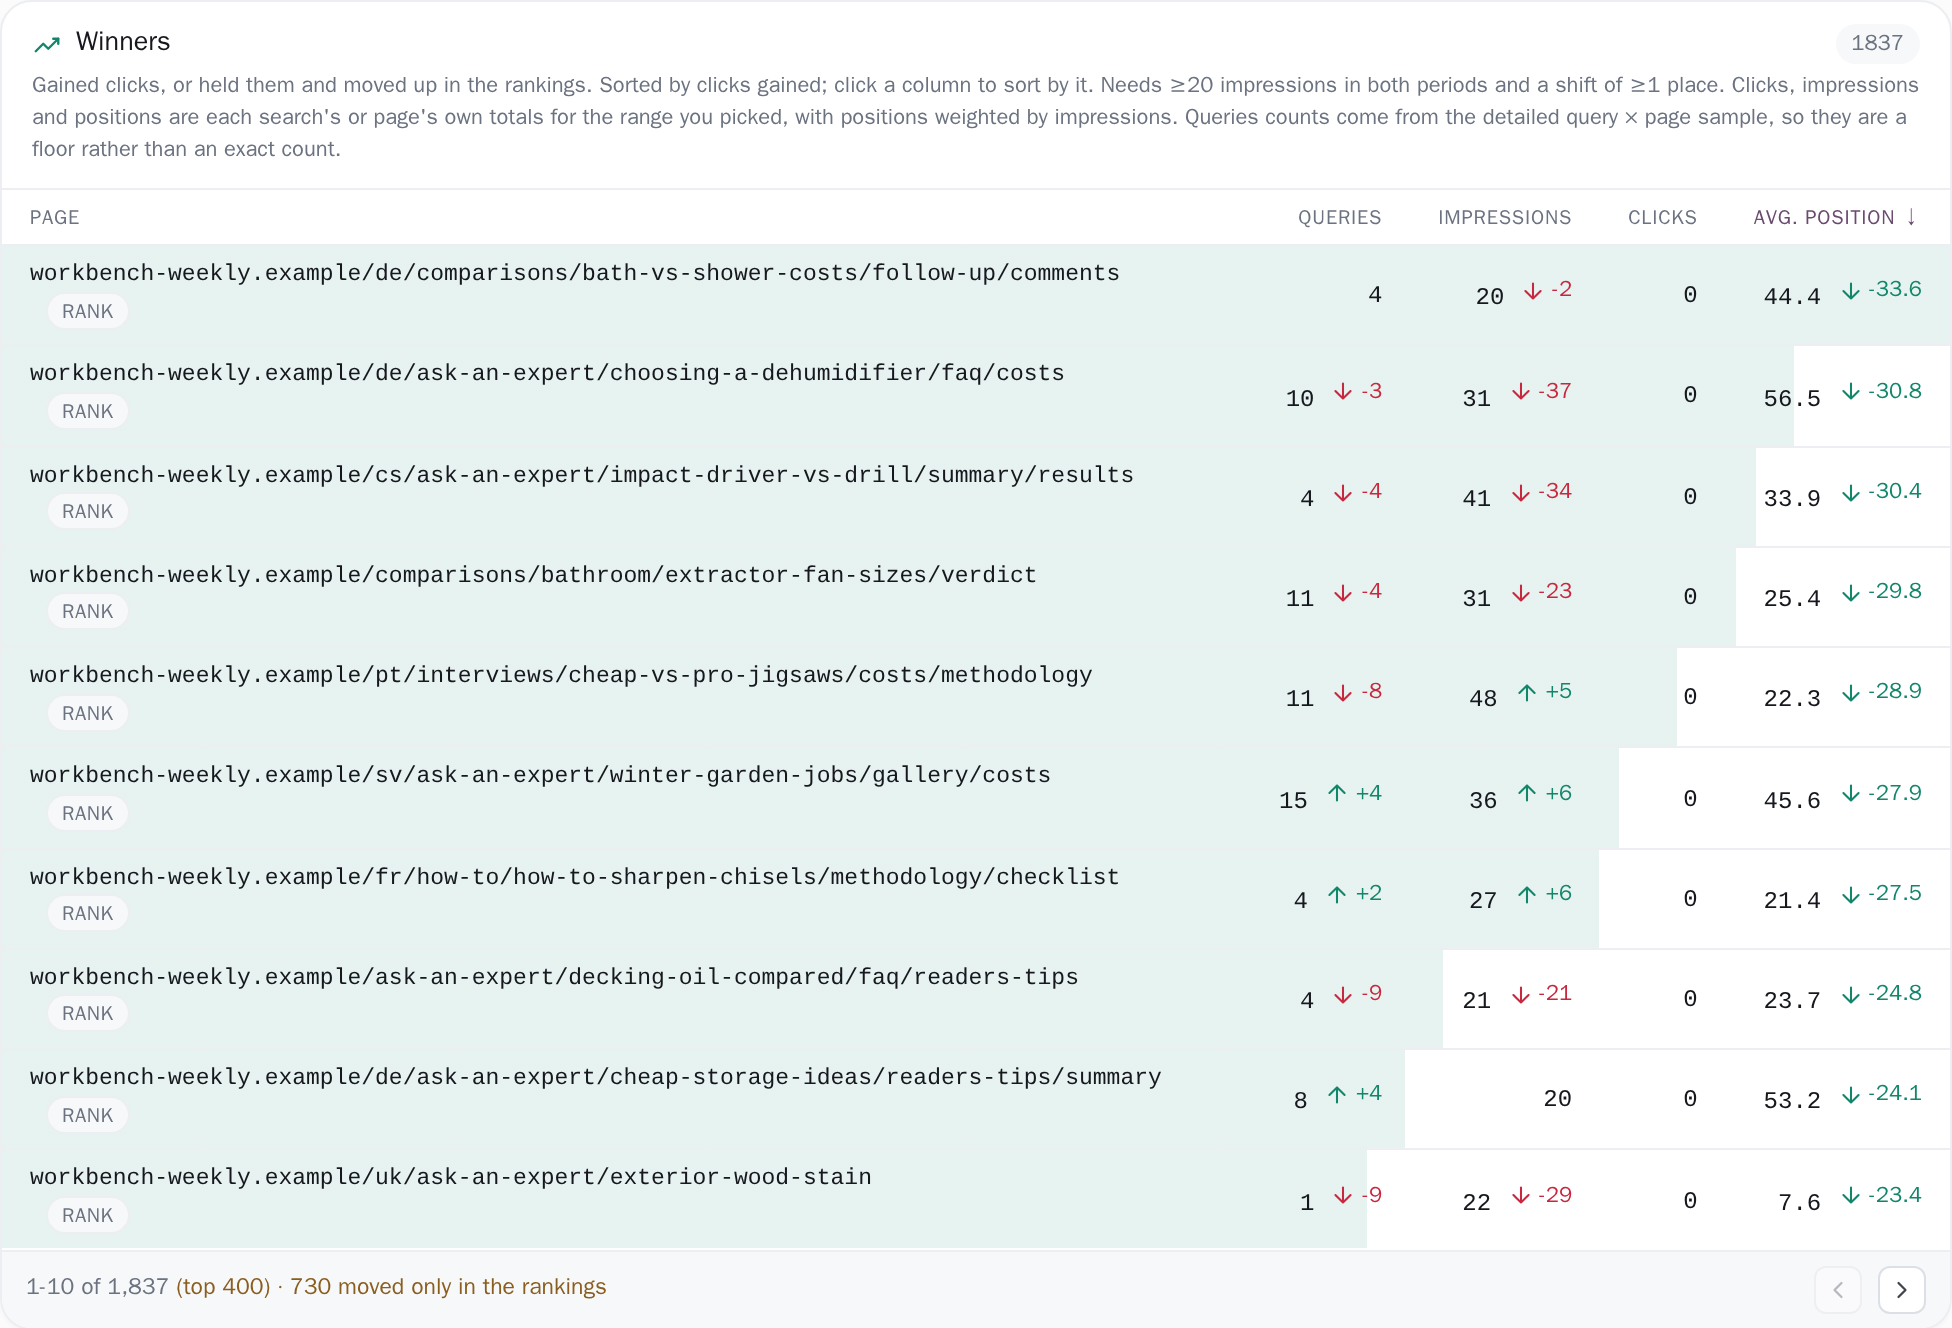
Pick the weeks either side of it and the Changes screen ranks what gained and what lost as pages, not only as queries, with impressions (the number of times a post appeared in someone's results), clicks, and average position, meaning where in the results you sat on average across all of them. Posts whose clicks held steady while their ranking moved are fetched as their own group so the big losers cannot crowd them out, and each one is tagged rank in the table, because those are the ones a rewrite still reaches.
The ranking column holds a line the others do not: under twenty impressions in either period it prints the rank but withholds the change, and the cell says on hover that a shift needs twenty in both periods before it counts as a shift. Otherwise a post with a handful of impressions shows a double-digit gain that is really just noise. Clicks and impressions are not filtered that way, so a small post that lost its few impressions is still in the list, with the numbers beside it.
Winners & losersThe posts that stopped showing at all.
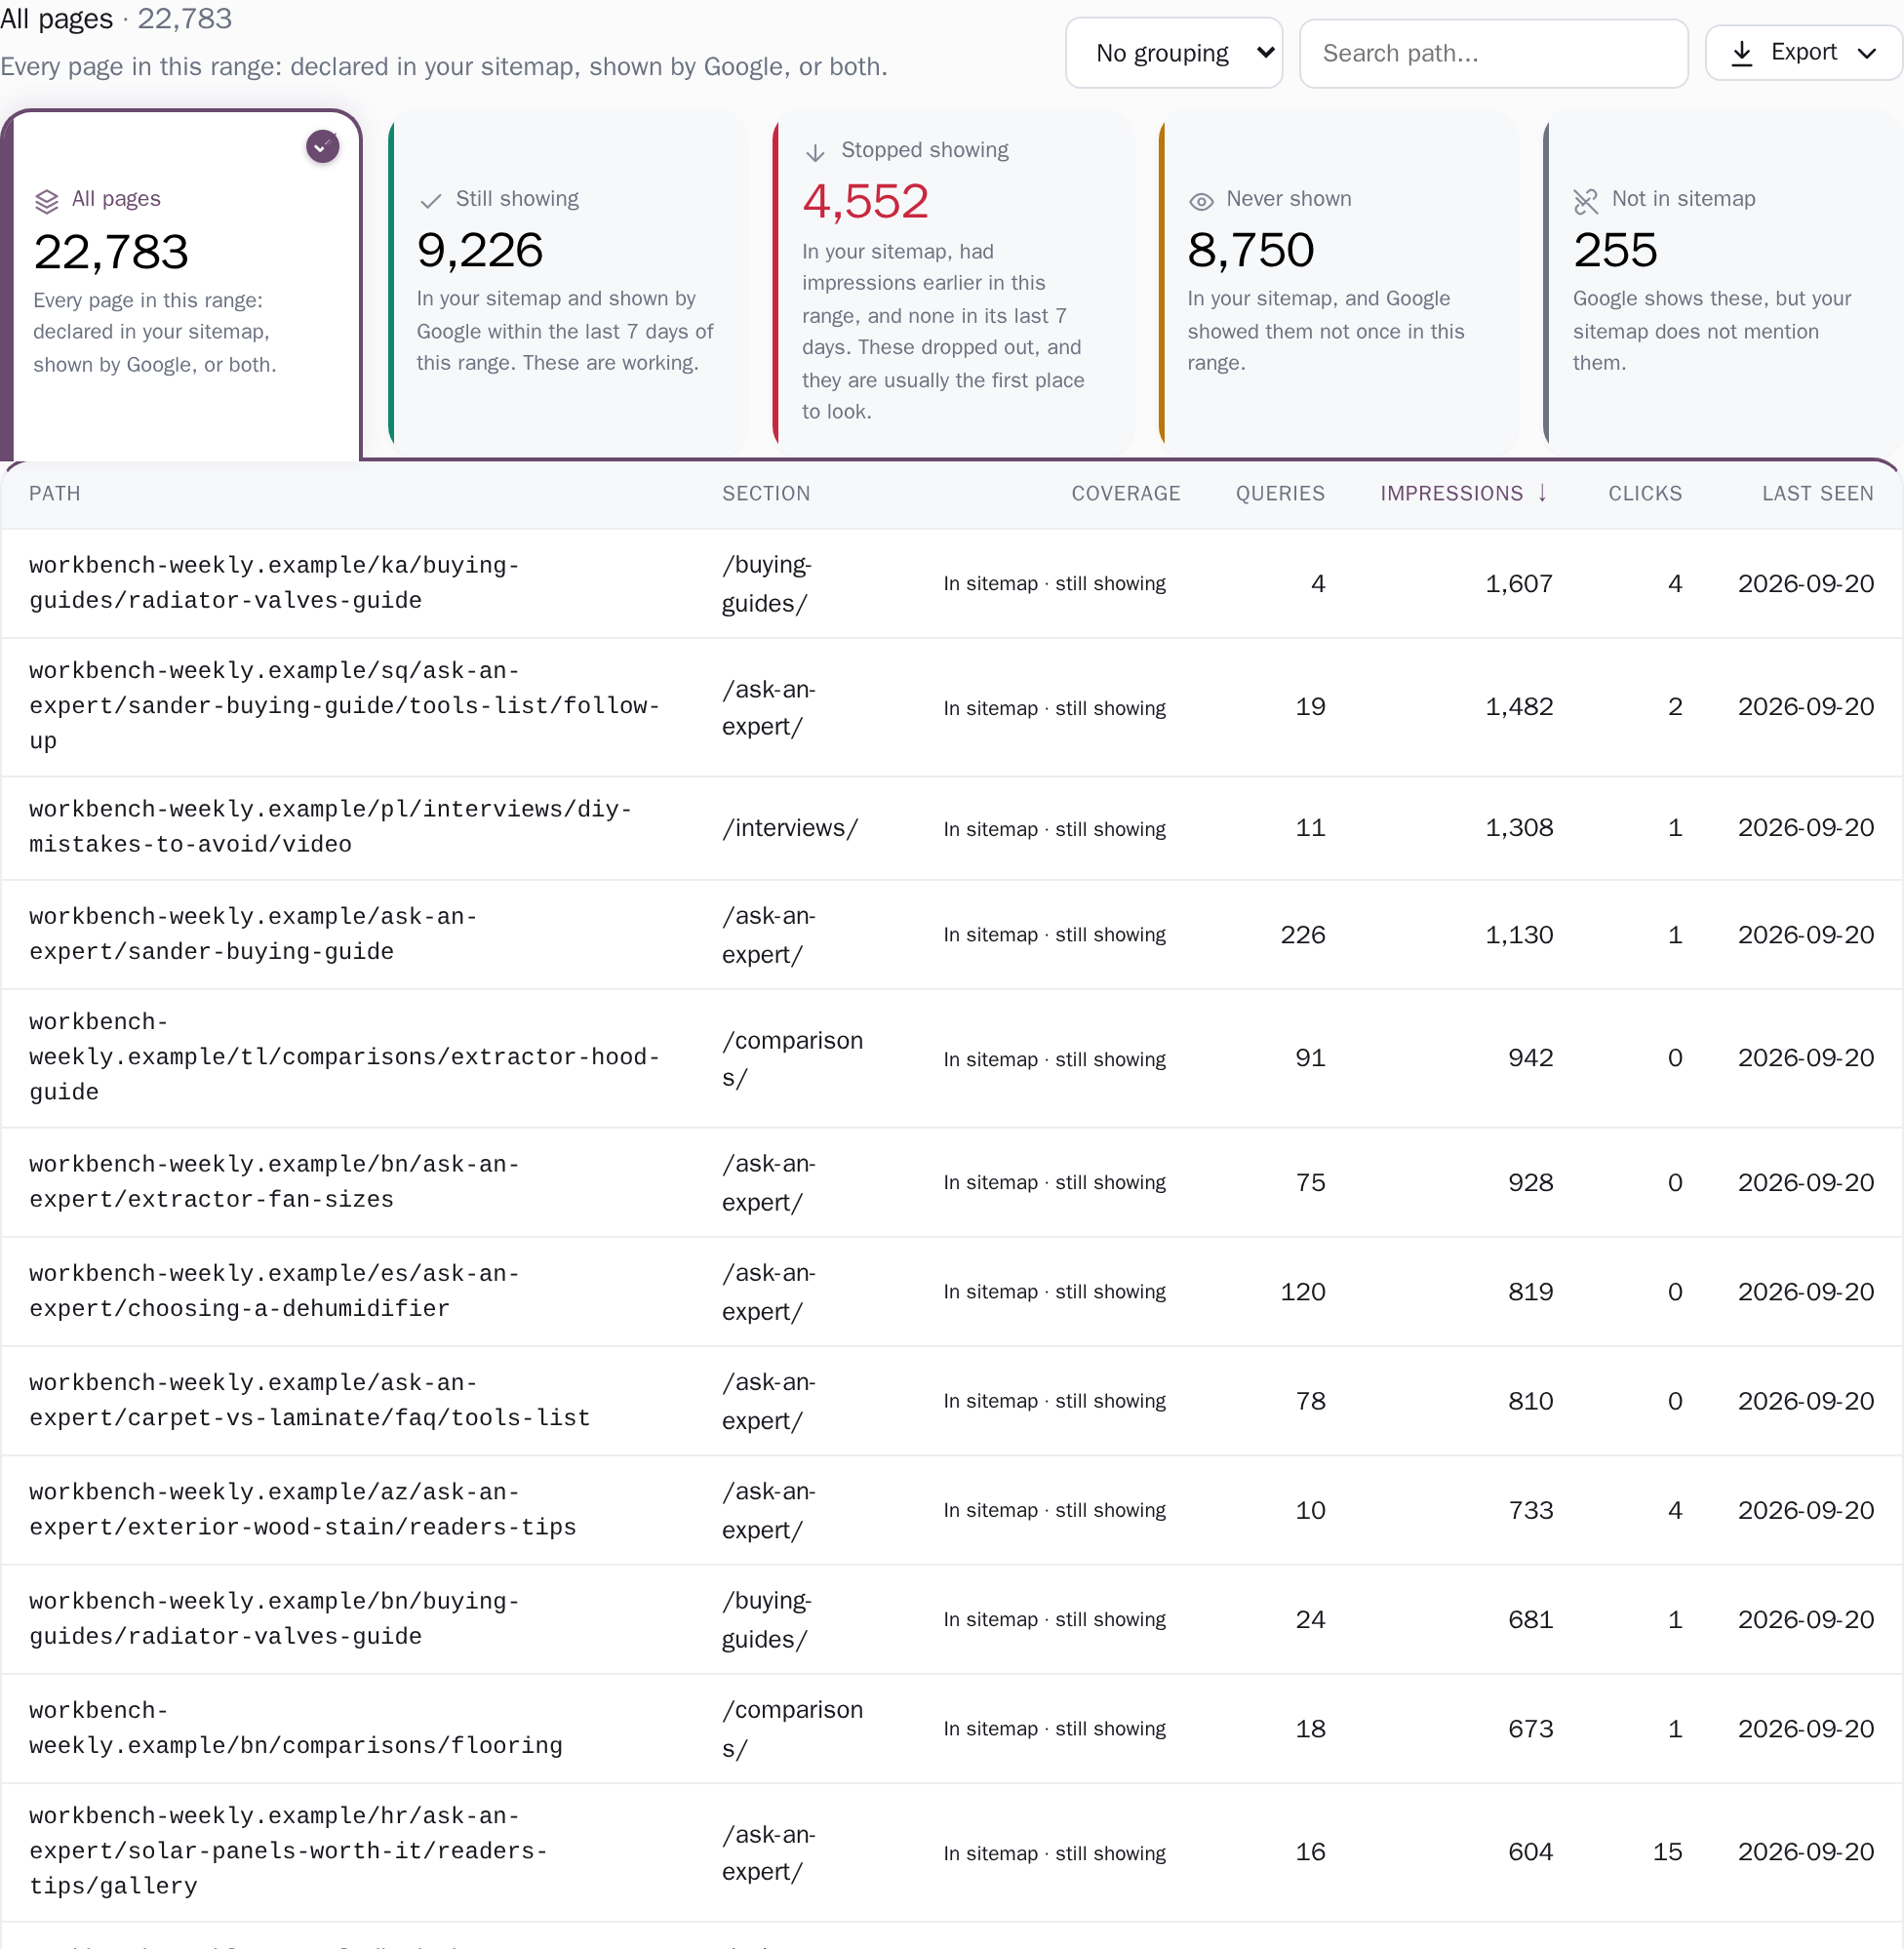
Page coverage reads your sitemap (robots.txt and the sitemap files it points at are the only things we ever ask your own server for) and sets what it declares against every page Google served in the range you picked, sorting them into four groups that add up to the whole: still showing, stopped showing, declared but never served in that range, and pages Google serves that your sitemap never mentions.
If the sitemap cannot be read, the page says so and says why, rather than filing your whole site under undeclared. You set what counts as stopped: three, seven, fourteen, twenty-eight, sixty or ninety days with no impressions, offered only where the threshold fits inside the range you are judging. A site crawled once a fortnight needs a longer silence before the silence means anything, and the floor is three days because Search Console itself publishes two to three days late.
Open a post to see the day it went quiet, drawn on a scale that starts at zero so a slide from healthy to nothing looks like a slide. Where the range reaches back past the per-page history we hold, those older days are marked unknown instead of drawn as zeros.
Page coverageEvery search term, not the first thousand.
The query list pages through the entire set rather than a top slice, and sorts and searches across all of it over whatever range you pick. The Pages tab download is the one that keeps a window of its own, a fixed last 90 days, while the query list downloads over the range you picked (CSV with no row cap, Excel to 200,000 rows with a line in the file where it stops) and it carries that window and its coverage in the file's own header.
Under the on-screen count sits a sentence measuring what share of your real clicks and impressions those queries account for, worked out against your property's own daily totals, because Google anonymizes rare searches away and a single day's query pull stops at about 5,000 rows, which is our own measurement against the API rather than a documented limit, and the days that hit that ceiling are marked as capped.
That sentence disappears the moment you filter, since the denominator is then no longer your site. A long tail that will not admit what it is missing is worse than a short one.
Every query Google namesWhat an update did, post by post
- Paid: 24 months of daily history, so the same month last year is always there to compare against
- Which posts an update cost you, ranked as pages and not just queries
- Posts Google has stopped showing, and the day they went quiet
- The posts that only slipped a place or two, kept out of the big losers' shadow
One site is free, with no card: every screen, over the last 14 days. Connect the property, let the first sync copy in what Google still holds, and see what a quarter of your own data tells you. Keeping 24 months around it, and the year-on-year comparison that needs them, is what the paid site at €10 a month is for. If you already know you want last year, start it paid: upgrading re-pulls the per-page and per-query detail for as far back as Google still serves it, but a day the free trim dropped that has since fallen out of Google's sixteen-month window cannot be fetched back by anyone. Walk away either way and nothing you did touched your site: all we ever do is read.
Related guides
What this measures, and where another tool owns the answer
What this measures is your presence in Google search, exactly: impressions, clicks, average position and the pages behind them, straight from Search Console. What that traffic earns is a different measurement, and the tools that own it are your ad network, your affiliate dashboard and Analytics. So this will tell you that a post lost two thirds of its impressions, and your ad network will price what that loss was worth.
Why an update hit you is a judgement rather than a reading, and keyword research and a competitor's rankings are a research suite's job. Alerts are raised inside the app, on the project's dashboard, beside the numbers that caused them, and the app and its downloads are how the data reaches you. Search Console itself publishes two to three days behind, and every figure here is dated accordingly.
What this does is narrower and sharper: every figure names the window it covers and whether it is complete or a sample, site totals and page-level movers are never merged into one claim, and a number too thin to stand on is withheld with a sentence saying why instead of printed as a zero.
Other teams reading the same data
Connect your site and see the first answer today
Sign in with Google, pick a property, and your dashboard fills in while you watch, with the screen counting the days as they land.