SEO specialists
The spreadsheet you rebuild every month, already built
You already know what the numbers mean. What you do not have is a way to get at them without exporting a thousand rows, pasting them into a sheet, rebuilding a pivot and finding that last month's version broke.
Segments that survive.
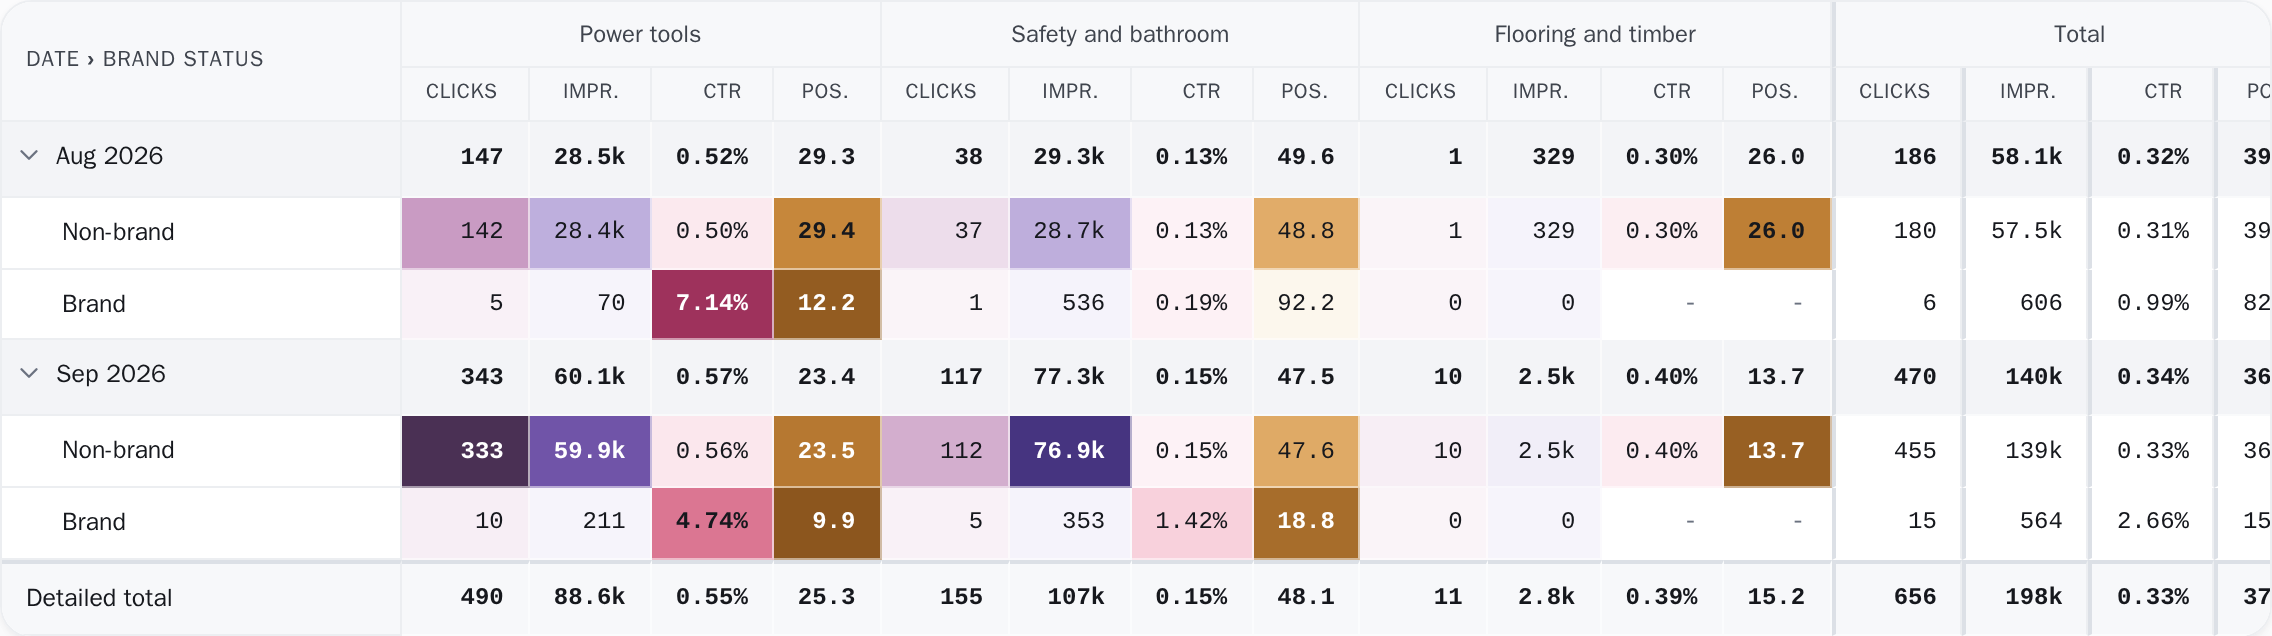
Define brand, sections, languages and intents once as rules, regex included, and every report reads by them. Publish a page tomorrow and it lands in the right segment without you touching anything.
Try a rule on 20 example paths
7 of 20 paths match
- /blog/search-console-basics
- /blog/core-update-recovery
- /blog/tag/analytics
- /blog/author/editor
- /de/blog/suchanfragen
- /fr/blog/mise-a-jour
- /es/blog/guia-rapida
- /services/technical-audit
- /services/local-seo
- /de/services/lokale-seo
- /fr/services/audit
- /case-studies/bakery
- /case-studies/dental-clinic
- /docs/getting-started
- /docs/api/export
- /pricing
- /about
- /contact
- /de/kontakt
- /careers
Try
Contains and regex are two of the rule editor's six tests. Both ignore case by default, and so does this one.
The whole long tail.
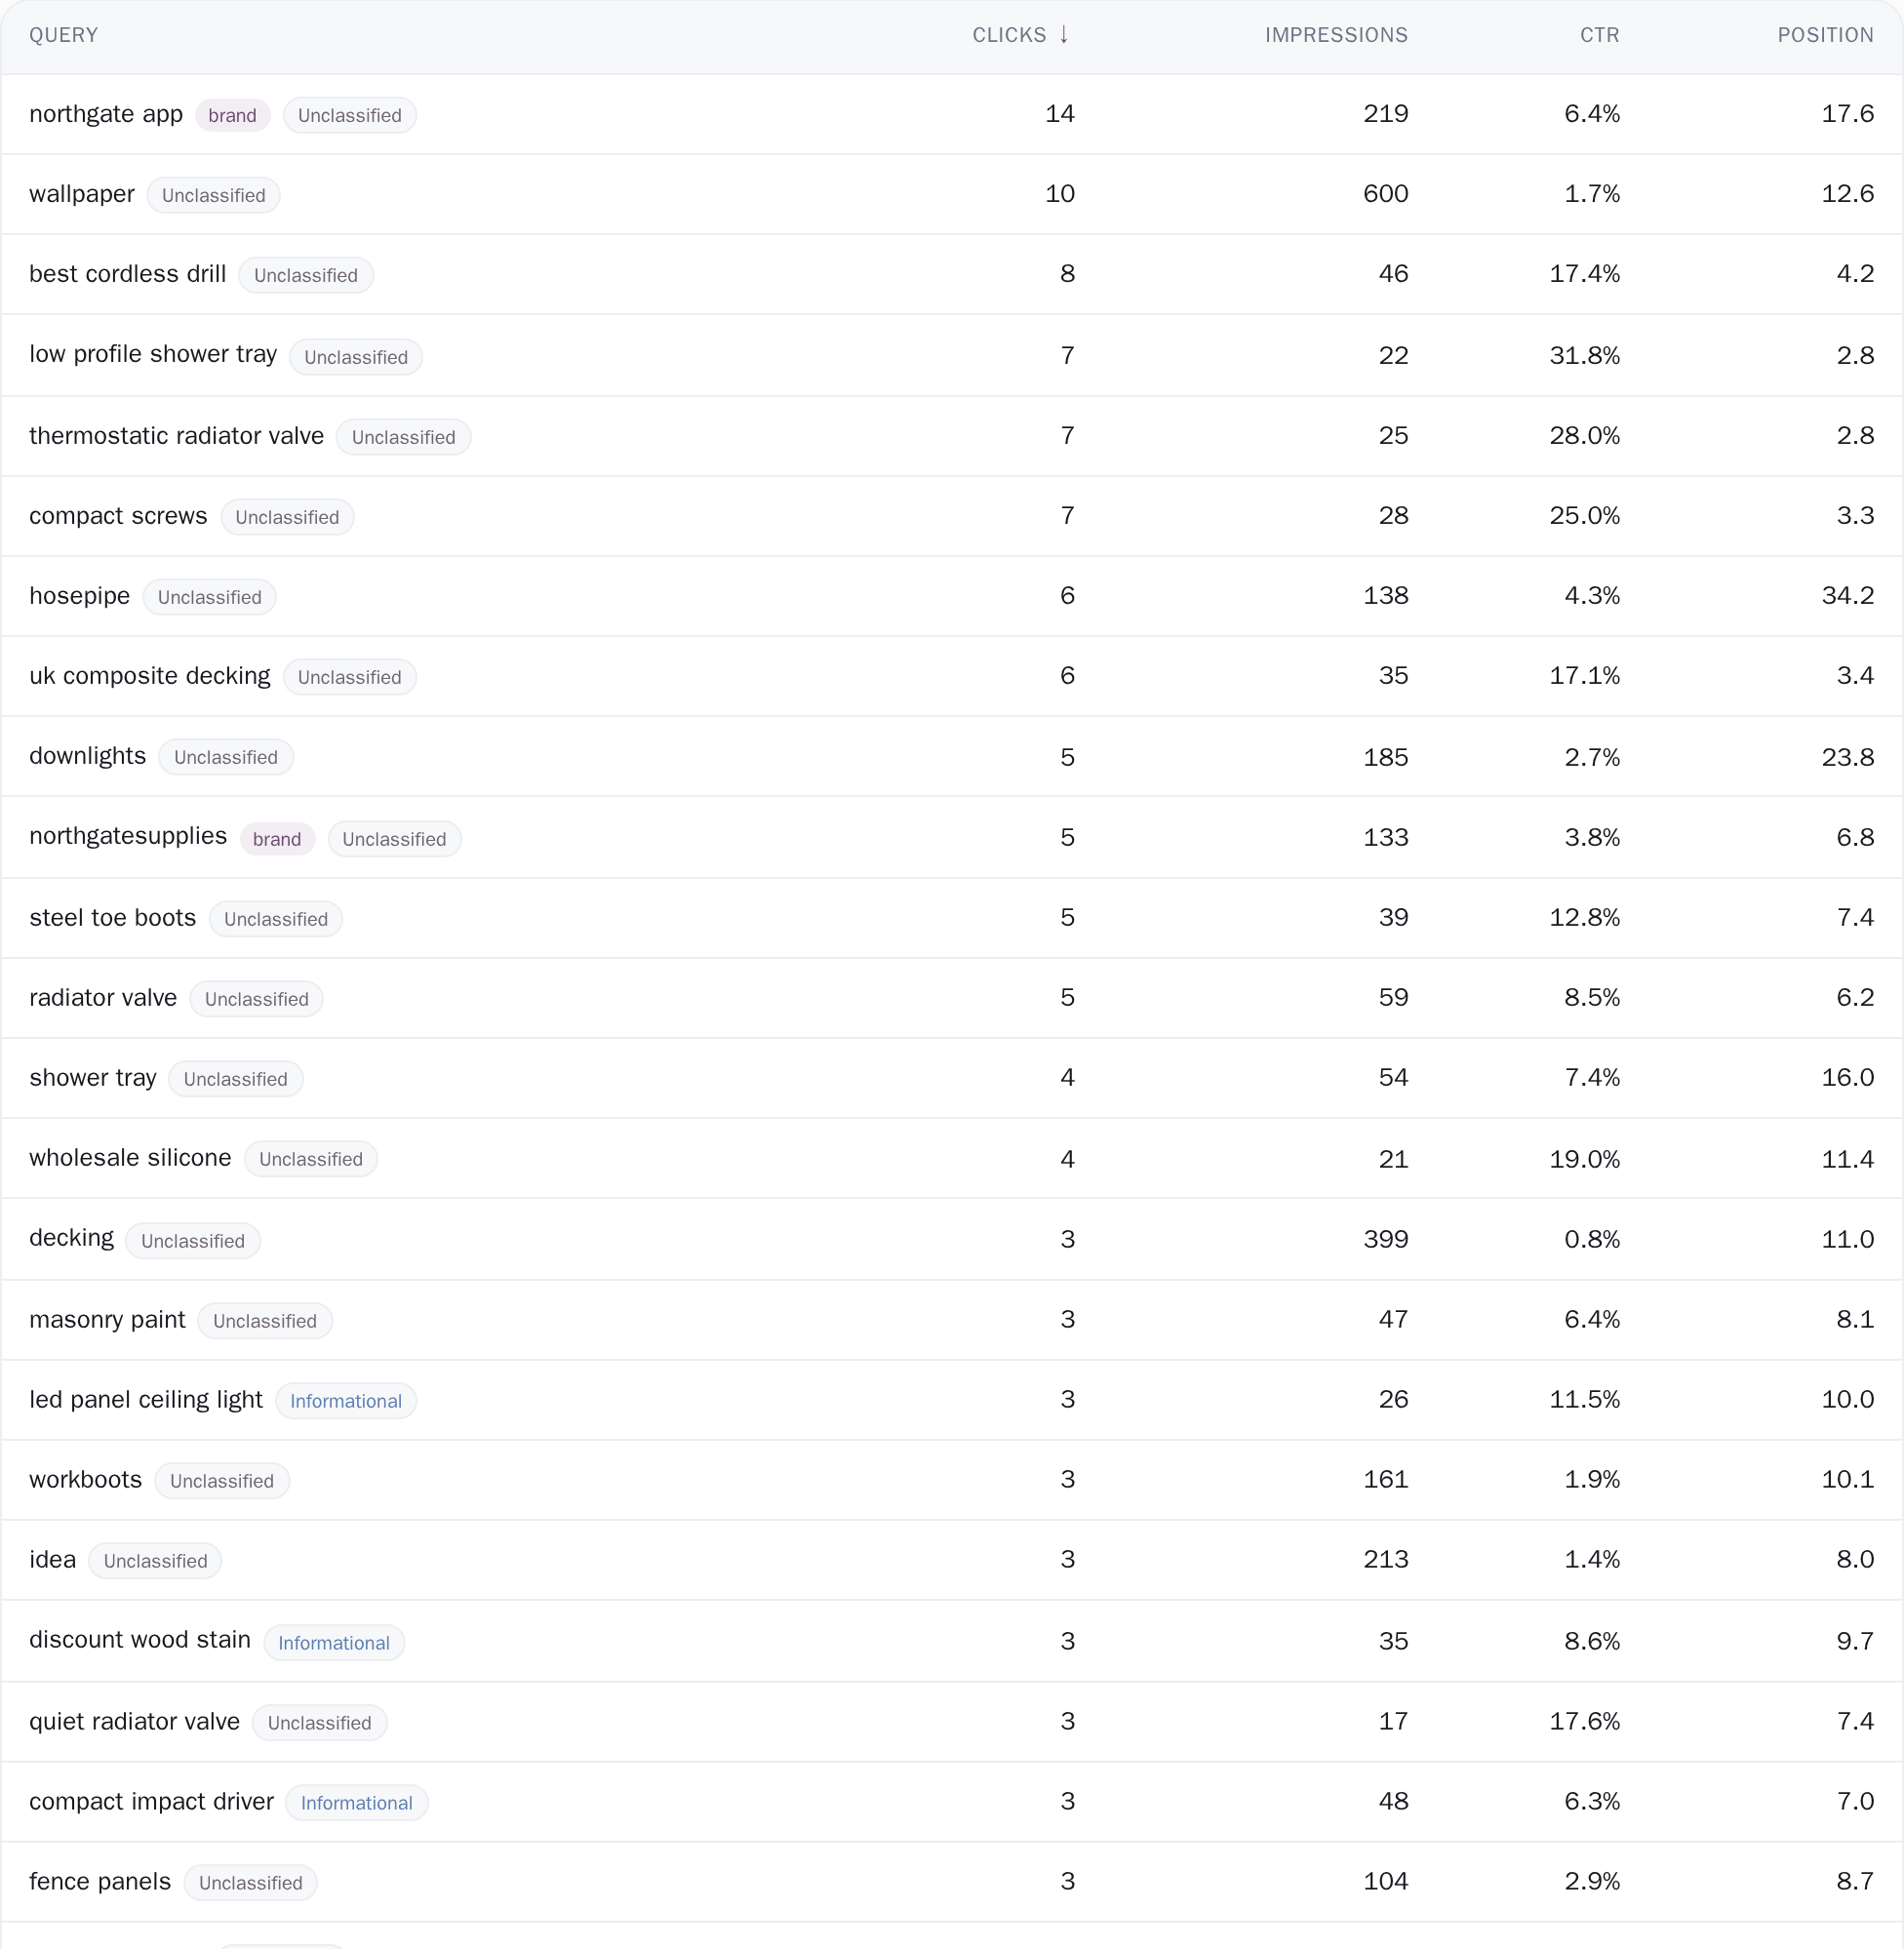
Past the 1,000 rows Search Console's own table shows: every query row Google's API returns, pulled day by day, searchable, filterable by intent and brand, and exported to CSV with no row cap or to Excel up to 200,000 rows.
Search Console's own Performance table, any range1,000 rows
The query list here, same property, 28 days35,930 queries
Pivots that hold up.
Any dimension by any dimension with multi-level drill-down and subtotals, computed on the server so site size does not slow the interface. Ratio metrics are recomputed at every level rather than averaged, so a subtotal is never quietly wrong. Every figure also carries the window it covers and whether it is complete or sampled, which is what lets you defend it in a client meeting.
Pivot analyticsCannibalization is a stated rule, run over the whole archive.
A query is listed once per language, and only when between 2 and 10 of your pages in that language appeared for it, those pages drew at least 50 impressions between them, no single page held 70% or more of those impressions, and the top two held at least half. The same term served by /de/ and by /fr/ is Google choosing a page per locale, and a page holding 95% is a clear winner, so the list keeps neither.
The rule runs over any range you pick, and the range reaches a long way back: the first sync copies in the ~16 months Google still holds, and from there the archive keeps a rolling 24 months, past the day Search Console deletes its own copy.
CannibalizationThe pivot you stop rebuilding every month
- Regex and rule-based grouping with a live match count
- Every query row Google's API returns, past the 1,000 on Search Console's own screen, with a CSV export that has no row cap
- Cannibalization filtered down to genuine conflicts
- 24 months of daily history for year-on-year that actually works
Connect a property and check our arithmetic against your own export. That is the comparison we would want to run.
Related guides
What this measures, and where another tool owns the answer
What this owns is the measurement and the archive behind it. Keyword research, a competitor's rankings, a backlink index and a technical audit are a research suite's job, and a research suite does them properly. Every number here comes from the read-only Search Console scope; from your own server we read exactly two things, robots.txt and your sitemap files, and we never render a page or read your HTML.
Position here means Search Console's average position, weighted by impressions: the rank Google actually served you at, across every appearance it recorded. Where you stand today from one fixed location is a rank tracker's measurement, and a rank tracker is the tool that settles it. The work here happens on the screens themselves, with alerts raised on the project's dashboard beside the data that triggered them; an automated reporting pipeline, a feed into another system and a branded deliverable on a schedule belong to the tools built for that, and Looker Studio reads the same Search Console data for free.
The query list carries Google's own limits on its face: rare searches are anonymized away, and in our own measurements a single-day query pull stops at 5,000 rows, which we store as a capped day and print as a floor rather than a total. What that narrow focus gives you is a 24-month archive, and a label under every number.
Other teams reading the same data
Connect your site and see the first answer today
Sign in with Google, pick a property, and your dashboard fills in while you watch, with the screen counting the days as they land.