Clicks, impressions, CTR and position in plain English
Search Console shows four numbers and assumes you know them. Most people half-know them, which is worse than not knowing, because a half-known metric still gets used to make a decision.
Last updated 2026-09-04 · The Clode team · Guides
The short version
Impressions = you appeared. Clicks = someone came. CTR = the share who came out of those who saw you. Position = how far down the page you were, averaged over every appearance. The trap is average position: it is weighted by impressions, so it moves when your mix of searches changes even if no ranking changed at all.
Impressions: you appeared
An impression is counted when a link to your site appeared in someone's search results. It does not mean they read it, scrolled to it, or noticed it. Appearing tenth still counts as an impression even though almost nobody scrolls that far.
Impressions are best read as demand plus visibility. Rising impressions with flat clicks usually means you started appearing for more searches, but in positions too low to earn a visit.
Clicks: someone actually came
A click is a visit that started from a Google search result. It will not match your website analytics exactly and it is not supposed to: Google counts the click, your analytics counts the page load, and people close tabs in between. A gap of a few percent is normal; a gap of half means something is wrong with one of the two measurements, not with your site.
CTR: the share of people who chose you
Click-through rate is clicks divided by impressions. It answers "of the people who saw me, how many came?"
There is no universal good number, because CTR is dominated by position: first place on a normal result page might take a quarter to a third of clicks and tenth place a fraction of a percent. Compare a page's CTR against other pages of yours in similar positions, not against an industry benchmark. A page with an unusually low CTR for its position is usually a title and description problem, and that is one of the few genuinely quick wins in search.
One arithmetic warning: you cannot average CTRs together. The CTR of a group of pages is that group's total clicks divided by its total impressions. Averaging the individual CTRs gives a different and wrong answer, and it is a mistake spreadsheets make constantly.
| Page | Clicks | Impressions | CTR |
|---|---|---|---|
| /a | 5 | 100 | 5.00% |
| /b | 1 | 900 | 0.11% |
| /c | 2 | 50 | 4.00% |
| Average of the three rates (wrong) | 3.04% | ||
| Total clicks divided by total impressions, 8 over 1,050 (right) | 0.76% | ||
How this works in Clode
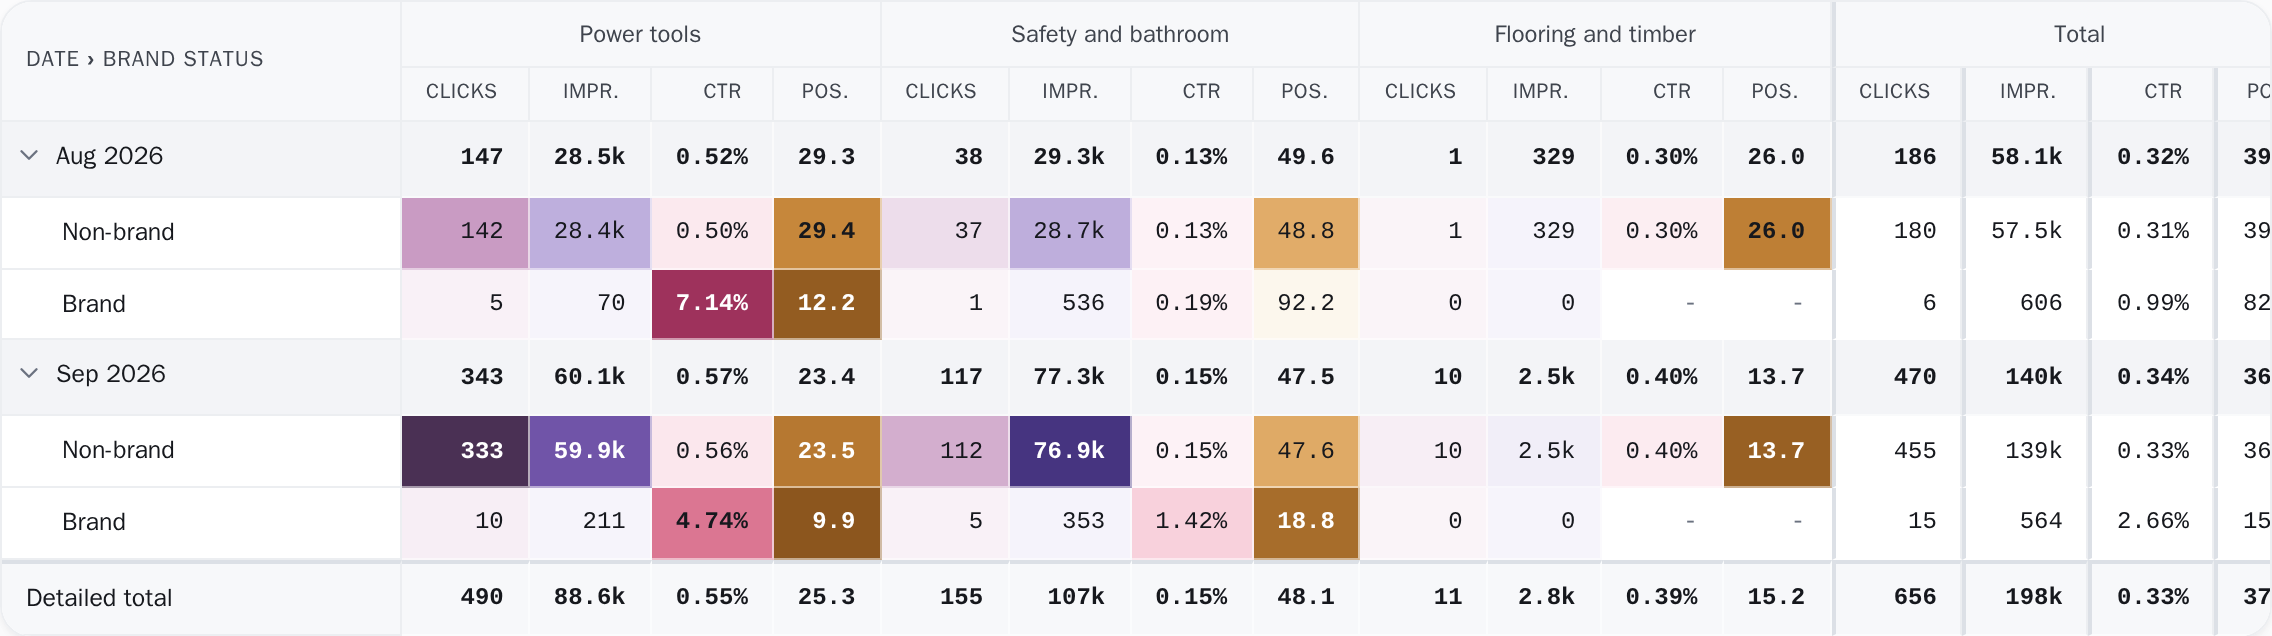
Clode's pivot table does this division for you at every level: each row, each subtotal and the grand total divides its own clicks by its own impressions, exactly as the arithmetic above requires.
Average position: the one that misleads
Position is where your link sat in the results. Average position is that, averaged across every impression, which is where the trouble starts.
Because it is weighted by impressions, your average position can get worse without a single ranking dropping. Start appearing for a new, broad search where you sit at position 40, and it drags the average down while everything else is unchanged. The reverse also happens: lose visibility on a weak search you never got clicks from and your average position "improves".
The fix is to stop reading it as a score. Look instead at the distribution (how many of your searches sit in the top three, in four to ten, and beyond) and always read an average alongside the number of searches behind it. If that count moved, the average is telling you about the mix, not about your rankings. If clicks fell as well, work through the drop step by step rather than starting from the average.
| Query | Position | Impressions |
|---|---|---|
| running shoes for flat feet | 3 | 100 |
| trail running shoes review | 3 | 100 |
| best running socks | 3 | 100 |
(3 × 100 + 3 × 100 + 3 × 100) ÷ 300 = 3.0
| Query | Position | Impressions |
|---|---|---|
| running shoes for flat feet | 3 | 100 |
| trail running shoes review | 3 | 100 |
| best running socks | 3 | 100 |
| shoes new | 40 | 200 |
(3 × 100 + 3 × 100 + 3 × 100 + 40 × 200) ÷ 500 = 17.8
The three traps, in one place
Averaging an average.
CTR and position must be recomputed from totals at every level. A "group CTR" that is the mean of its pages' CTRs is simply a different number wearing the right label.
Sampled data reported as total.
Query-level detail is often a subset of what the site totals cover. If a screen shows a metric derived from that subset and labels it as the site figure, it can be out by a factor of several, and nothing on screen will look wrong.
Mismatched windows.
Comparing a complete period against one that includes the last two incomplete days makes a fall out of nothing.
Where this matters in practice
These are not academic. Every one of them has shipped in real analytics products, including in earlier versions of ours: we found a keyword-group CTR reading 4.33% where the true figure was 0.47%, because it was computed from a sample and labelled as the total.
That is why every number in Clode carries the window it covers and whether it is complete or sampled, why ratio metrics are recomputed at every level of every table, and why a figure we cannot label honestly is not displayed at all. For an audience without a second data source to check against, a plausible wrong number is the most damaging thing a tool can produce.